1. Introduction
Qualitative data analysis has a long history in the social sciences. Reflecting this, a substantial literature has developed to guide the researcher through the process of qualitative data analysis (e.g. Bryman & Burgess, 1994; Harding, 2018; Saunders et al., 2019; Silverman, 2017). While earlier literature focuses on the manual approach[1] to qualitative data analysis (Bogdan & Bilken, 1982; Lofland, 1971), more recent literature provides support in the application of a range of technological approaches (alternatively referred to as Computer Assisted Qualitative Data Analysis Software or CAQDAS): e.g., Excel (Meyer & Avery, 2009); NVivo (Jackson & Bazeley, 2019); and ATLAS.ti (Friese, 2019). Moreover, in an accounting context, a critical literature has emerged which attempts to elucidate the messy and problematic nature of qualitative data analysis (Ahrens & Chapman, 2006; Lee & Humphrey, 2006; Modell & Humphrey, 2008; O’Dwyer, 2004; Parker, 2003). However, while a substantial literature exists to guide the researcher in undertaking qualitative data analysis and in providing an understanding of the problematic nature of such analyses, a dearth of research reports on the comparative experiences of those undertaking qualitative data analysis using different approaches. The paper aims to address this gap by reporting on the experiences of two recently qualified doctoral students as they reflect on how they each approached the task of analysing qualitative data, Researcher A (second author) choosing a technological approach (NVivo) while Researcher B (third author) opted for a manual approach. The paper contributes to the limited literature which explores the comparative experiences of those undertaking qualitative data analysis using different approaches. In so doing, we hope that the critical reflections and insights provided will assist qualitative researchers in making important decisions around their approach to data analysis.
The remainder of the paper is structured as follows. In section two, we provide an overview of the problematic nature of qualitative research and a review of the manual and technological approaches of data analysis available to researchers. Section three follows with a discussion of two qualitative PhD studies. Section four discusses the experiences, challenges and critical reflections of Researchers A and B as they engaged with their particular approach to qualitative data analysis. The paper concludes with a comparative analysis of the experiences of Researchers A and B and implications for further work.
2. Literature Review
2.1 A Qualitative Research Approach: Debates and Challenging Issues
Qualitative researchers pursue qualia, that is phenomena as experienced (sometimes uniquely) by individuals, that enlarge our conception of the “really real” (Sherry & Kozinets, 2001, p. 2). Qualitative studies seek to answer ‘how’ and ‘why’ rather than ‘what’ or ‘how often’ questions. In so doing, qualitative studies involve collecting rich data that are understood within context and are associated with an interpretivist philosophy. Mason (2002) notes that qualitative research is not just about words, rather it reflects a view of practice that is socially constructed and requires researchers to embrace subjectivity in order to interpret data. Furthermore, Bédard & Gendron (2004) argue that “being tolerant of uncertainty is part of the fundamental skills of the qualitative researcher” (p. 199). That said, a qualitative approach can be extremely labour intensive, given the volume of data collected and the commitment required to generate themes.
In the accounting and management literatures, there has been considerable debate on the challenges of qualitative data analysis. In early work, Parker (2003) highlights a potential challenge in that qualitative researchers need to be reflexive in the data analysis process. To that end, researchers often construct field notes and memos (during interviews for example) to report their feelings, perceptions and impressions, which can be viewed as data, alongside all other data collected from the field. Bédard & Gendron (2004) highlight a further challenge in that analysing qualitative data is both labour intensive and requires high levels of research knowledge and ability. Furthermore, they argue that qualitative researchers need to be immersed in data collection and analysis, and should be mindful that the “specific objectives of the study are not always determined a priori, but often ‘emerge’ from fieldwork” (p. 200). Ahrens & Chapman (2006) identify the challenge of data reduction without “‘thinning’ out the data to the point where it loses its specificity and becomes bland” (p. 832). Qualitative data analysis is, they argue, not a straightforward process: “Like other practices, the doing of qualitative field studies is difficult to articulate. One can point to the golden rules but, at the heart of it lies a problem of transformation. Out of data, snippets of conversations and formal interviews, hours and days of observation, tabulations of behaviours and other occurrences, must arise the plausible field study” (Ahrens & Chapman, 2006, p. 837). This chimes with O’Dwyer’s (2004) description of qualitative data analysis as ‘messy’. To address this, O’Dwyer (2004) highlights the importance of imposing structure onto the analysis process and outlines an intuitive approach to analyse interview data using Miles and Huberman’s (1994) three stage process of data reduction, data display and data interpretation/conclusion drawing and verification. This process involves the categorisation of themes and individual aspects of interviews in several stages to ensure that general patterns and differences are articulated. While O’Dwyer (2004) considered using a technological approach to assist in data analysis, he discounted it as an option at an early stage of his research, largely as a result of his lack of understanding of what it could offer. Lee & Humphrey (2006) also argue that analysing interview transcripts is a key challenge facing qualitative researchers. In particular, deciding “what weight to give to meanings that are only apparent in a part of an interview, how to retain understanding of the whole interview when the focus is on individual parts and how to derive patterns both within and across interviews without losing sight of any idiosyncratic elements that may provide unique insights” (p. 188). Finally, Modell & Humphrey (2008, p. 96), while calling for further research in the area of qualitative data analysis, contend that problems exist where there is undue focus on the approach to data analysis to the detriment of the development of ideas. They suggest that this appears to be an increasingly common issue, particularly with increased use of technology in the data analysis process.
2.2 Approaches to Data Analysis: Manual and Technological (i.e. NVivo) Approaches
The data analysis phase of qualitative research is described as the “most intellectually challenging phase” (Marshall & Rossman, 1995, p. 114) and the active role of the researcher in identifying and communicating themes is critical (Braun & Clarke, 2006; Edwards & Skinner, 2009; Silverman, 2017). While early technological approaches to data analysis have been in existence since the 1960s, many qualitative researchers have continued to employ the manual approach to analysis (Séror, 2005). In part, this may be due to the perceptions of some researchers that the technological approach may attempt to do more than assist in the management of data, potentially influencing the abstraction of themes from data in unintended ways (Crowley et al., 2002). However, a review of the literature suggests that the manual approach can be an unwieldy, cumbersome, “tedious and frustrating” process (Basit, 2003, p. 152). Furthermore, comparatively little has been published in relation to the mechanics of the manual approach (Bazeley, 2009; Bogdan & Bilken, 1982; Braun & Clarke, 2006; Edwards & Skinner, 2009; Lofland, 1971; Maher et al., 2018; Miles & Huberman, 1994; Silverman, 2017).
Edwards & Skinner (2009) assert that the manual analysis of hundreds of pages of raw data is a “daunting” task (p. 134). To assist in this process, some basic mechanical procedures are described in the literature, including: printing hardcopy transcripts, photocopying, marking up, line-by-line coding, coding in margins, cutting, cut-and-paste, sorting, reorganising, hanging files and arranging colour-coded sticky notes on large format display boards (Basit, 2003; Bogdan & Bilken, 1982; Lofland, 1971; Maher et al., 2018; L. Richards & Richards, 1994). Moreover, Braun & Clarke (2006) provide a comprehensive description of the manual data analysis process, involving “writing notes on the texts you are analysing, by using highlighters or coloured pens to indicate potential patterns, or by using ‘post-it’ notes to identify segments of data” (p. 89). As ‘codes’ are identified, data extracts are manually grouped and collated within the individual codes. The subsequent generation of sub-themes and overarching themes involves the trialling of combinations of codes until “all extracts of data have been coded in relation to them” (p. 89). The above is an iterative process and involves re-reading, coding and recoding until all data has been included in sub-themes and overarching themes. The researcher’s interaction with the data is important in this regard, and involves a series of physical activities around arranging and re-arranging data excerpts and post-it notes, followed by visual mapping on “large format display boards” (Maher et al., 2018, p. 11). This process “encourages a slower and more meaningful interaction with the data [and] great freedom in terms of constant comparison, trialling arrangements, viewing perspectives, reflection and ultimately developing interpretative insights” (Maher et al., 2018, p. 11).
An alternative to the manual approach is the use of CAQDAS (i.e. technological approach) to support qualitative data analysis. CAQDAS offers the ability to import, organise and explore data from various sources (text, audio, video, emails, images, spreadsheets, online surveys, social and web content). The origins of NVivo, one of the market leaders, can be traced back to the 1980s with the development of a computer programme called Non-numerical Unstructured Data Indexing Searching and Theorizing (NUD*IST). Richards, one of the co-developers of NVivo provides an “intellectual history” of NUD*IST and NVivo (R. Richards, 2002, p. 199), arguing that “NVivo … is being preferred by researchers wishing to do a very detailed and finely articulated study … [and that NVivo’s] tools support close and multi-faceted analysis on small and moderate amounts of data” (p. 211). Reflecting its widespread usage as a mainstream CAQDAS, a literature has now developed around the use of NVivo. For example, Bandara (2006) provides guidance to novice researchers and academics involved in NVivo research training in information systems research; García-Horta & Guerra-Ramos (2009) provide reflections on the use of NVivo in education; Leech & Onwuegbuzie (2011) present guidance for psychology researchers; and Zamawe (2015) presents experiences in the context of health professionals.
Acknowledging that little is known about how researchers use CAQDAS, Paulus et al. (2017) present the results of a discourse analysis of some 763 empirical studies which use NVivo or ATLAS.ti (a competitor of NVivo – see https://atlasti.com/). Drawing on peer reviewed papers, published between 1994 and 2013, Paulus et al. (2017) report that the majority of researchers (87.5% of their sample) using CAQDAS to support qualitative data analysis fail to provide details of the technological approach used beyond naming the software, or what they refer to as ‘name-dropping’. Some 10% of the sample provide moderate levels of reporting, mainly concerned with “descriptions of software capability” (Paulus et al., 2017, p. 37). The remaining 2% of the sample provide more detailed descriptions of the CAQDAS used, including “detailed descriptions of how the analysis was conducted” (p. 39) or “how the researchers used the software to go beyond coding to a deeper layer of analysis” (p. 41). Based on their findings, Paulus et al. (2017) suggest that future studies should provide more detail about their experiences of using CAQDAS to support qualitative data analysis, including: what software is used; how they are used; why they are used; and how effective they have been.
A limited number of studies report on the benefits and drawbacks of using NVivo. In an early study, García-Horta & Guerra-Ramos (2009) report their experiences of using NVivo (and MAXQDA) to analyse qualitative data collected from teachers. Their experiences suggest a number of advantages, including the ability to: organise and store large volumes of data; deal with data overload; and enable fast and efficient retrieval of relevant information. However, they also highlight a number of limitations, most notably the “real hard work” of “generating categories or taxonomies, assigning meaning, synthesizing or theorizing” (p. 163) which, they argue, remains that of the researcher and not the software. García-Horta & Guerra-Ramos (2009) also highlight the potential for “data fetishism … or the ‘let’s code everything’ strategy [which] can lead to excessive and non-reflexive coding” (p. 163). They caution against the possibility of assumptions that ‘meaning-making’ can be computerised and the possibility of what they call ‘technologism’ whereby there is an implicit assumption that the qualitative data analysis process will be enhanced by the use of software. More recently, Zamawe (2015) argues that NVivo works well with most research designs as it is not methodologically specific and “the presence of NVivo makes it more compatible with grounded theory and thematic analysis approaches” (p. 14). Furthermore, Zamawe (2015) suggests NVivo eases the burden associated with manual qualitative data analysis in terms of the ‘copy-cut-paste’ requirement. NVivo also lends itself to more effective and efficient coding, and the reshaping and reorganisation of the coding structure by “simply clicking a few buttons” (p. 14). Zamawe (2015), however, points out some pitfalls associated with using NVivo. These include: the time consuming, and difficult, nature of the software; the potential for NVivo to “take over the analysis process from the researcher” (p. 15); the process of coding the data; and the danger of the researcher becoming distant from his/her data with the result that the ‘thickness’ of the data is diluted.
2.3 Comparison of Manual and Technological Approaches
Few studies report on comparisons of the manual and technological approaches to qualitative data analysis. In one such study, Basit (2003) compares the use of the manual and technological approach to qualitative data analysis drawing on two research projects. She argues that the approach chosen is dependent on the size of the project, the funds and time available, and the inclination and expertise of the researcher. Basit (2003) maintains that while the technological approach may not be considered feasible to code a small number of interviews, it is more worthwhile when a large number of interviews are involved. When compared to the manual approach, she highlights a number of perceived benefits of the technological approach. First, the data analysis process is relatively smooth and facilitates a more in-depth analysis. Second, the search facility is particularly useful, as is the ability to generate reports. Despite the perceived benefits, Basit (2003) acknowledges some challenges of the technological approach when compared to the manual approach. There is a considerable amount of time and formal training involved in getting acquainted with a software package to code qualitative data electronically, an investment not required for the manual approach. However, that said, Basit notes that the benefit of the software search facility and the generation of comprehensive reports compensates for the time investment required. In another study, Maher et al. (2018) argue that qualitative data analysis software packages, such as NVivo, do not fully scaffold the data analysis process. They therefore advocate for the use of manual coding (such as using coloured pens, paper, and sticky notes) to be combined with digital software to overcome this. Reflecting on their research, which combined both a manual and software analysis, they argue that NVivo provides excellent data management and retrieval facilities to generate answers to complex questions that support analysis and write-up, a facility not available with a manual approach. However, they suggest that the manual approach of physically writing on sticky notes, arranging and rearranging them and visual mapping, encourages more meaningful interaction with the data, compared to a technological approach. Furthermore, they advocate that the manual approach has a particular advantage over the technological approach as manual analysis usually results in displays of the analysis. The resulting visualisations, sticky notes, and concept maps may remain in place, allowing the researcher to engage with the research material on a variety of levels and over a period of time. In contrast to the manual approach, Maher et al. (2018) believe that NVivo operated on a computer screen does not facilitate broad overviews of the data and that data views may therefore become fragmented.
The above review indicates that limited research has reported on the comparative experiences of those undertaking qualitative data analysis. This paper addresses this gap, and in so doing, reports on the experiences of two recently qualified doctoral students, as they each reflect on how they approached the task of analysing qualitative data using different approaches. Section three presents details of the two research projects.
3. The Doctoral Research Projects
In this section, the background, motivation and research question/objectives of the research projects undertaken by Researchers A and B (both undertaking a part-time PhD) are outlined. This provides context for a comparison of the technological (NVivo) and manual approaches used for qualitative data analysis.
3.1 Researcher A: Background, Motivation, Research Question and Objectives
Researcher A (a Chartered Accountant) investigated financial management practices in agriculture by exploring the financial decision-making process of Irish farmers. When the literature in the area of farm financial management (FFM) was explored, it became apparent that there were relatively few prior studies, both internationally and in the Irish context (Argiles & Slof, 2001; Jack, 2005). The limited literature posed particular difficulties and frustration when conducting this research, but also demonstrated that there was a gap in the literature that needed to be addressed. The review of the literature identified a number of key issues which were central to the motivation of the research project. First, the majority of farmers appear to spend very little time on financial management (Boyle, 2012; Jack, 2005) and second, farmers tend to rely on intuition to a large extent when managing their farm enterprise (Nuthall, 2012; Öhlmér & Lönnstedt, 2004).
Researcher A’s overall research question was: How and why do farmers make financial decisions? To address this question, two research objectives were formulated following a detailed literature review and findings from preliminary research, namely a pilot survey of farmers and key informant interviews. The theoretical framework adopted (sensemaking theory) also assisted in framing the research objectives.
Research Objective 1: To explore the financial decision-making process of farmers by examining:
-
The factors that influence farmer decision-making;
-
The role of advisors in farmer decision-making;
-
The role of FFM in farmer decision-making;
-
The role of other issues in farmer decision-making (e.g. demographic factors such as farm type, age and level of education of the farmer, and the role of intuition in farmer decision-making).
Research Objective 2: To establish how farmers make sense of their business situations in order to progress with decisions of a financial nature.
The research methodology chosen by Researcher A was interpretivist in nature (Ahrens & Chapman, 2006). This was based on the assumption that farmers’ realities (in regard to how financial decisions are made) are subjective, socially constructed and may change. As a result, it was considered necessary to explore the subjective meanings motivating the decisions of farmers in order to understand the farmers’ decision-making processes. Interviews were considered the most appropriate data collection method to operationalise the interpretivist methodology chosen. The data collected via interviews with farmers allowed Researcher A to develop thick and rich explanations of how farmers make financial decisions.
3.2 Researcher B: Background, Motivation, Research Question and Objectives
Researcher B (also a Chartered Accountant) examined accounting practitioners’ perceptions of professional competence and their engagement with Continuing Professional Development (CPD) activities, as they strive to maintain and develop competence. Educational guidance on mandatory CPD within the profession was introduced in 2004 (IES 7, 2004), and while CPD is viewed as a bona fide stage in the lifecycle of professional education, it is in a state of infancy and transition and has yet to grow to achieve coherence, size and stature equivalent to the pre-qualification stage (Friedman & Phillips, 2004). While professional accountancy bodies may interpret IES 7 guidance and almost exclusively decide what counts as legitimate or valid CPD, individual practitioners are mandated to complete and self-certify relevant activities on an annual basis in order to retain professional association. It is therefore questionable whether the annual declaration encapsulates the totality of practitioners’ learning and professional development in relation to professional competence (Lindsay, 2013).
A review uncovered an extensive literature, concentrating on professionalisation, competence and professional education and learning, with attention focusing on the accounting domain. The following emerged: literature on professionalisation pertaining to the pre-qualification period (Flood & Wilson, 2009); findings on competence, education and learning largely focusing on higher education (Byrne & Flood, 2004; Paisey & Paisey, 2010); and CPD studies predominantly reporting on engagement (Paisey et al., 2007). The literature review highlighted a research gap and acknowledged the need for enhanced understanding in relation to post-qualification stages, where learning and professional development could more appropriately be examined from a competence angle (Lindsay, 2013).
The overall research objective of Researcher B’s study was to explore how individual accounting professionals perceive professional competence, and how, in light of these perceptions, they manage their CPD with the purpose of maintaining and further developing their professional competence. Given that the study set out to gain an understanding of individual perceptions and practices, this supported the use of an interpretivist approach (Silverman, 2017). A phenomenographic approach (a distinct research perspective located within the broad interpretivist paradigm) was selected. The root of phenomenography, phenomenon, means “to make manifest” or “to bring light” (Larsson & Holmström, 2007, p. 55) and phenomenography examines phenomena “as they appear to people” (Larsson & Holmström, 2007, p. 62). The phenomenographic approach is an experiential, relational and qualitative approach, enabling the researcher to describe the different ways people understand, experience, and conceptualise a phenomenon (Larsson & Holmström, 2007; Marton, 1994). It emphasises the individual as agent who interprets his/her own experiences and who actively creates an order to his/her own existence. It therefore facilitated the exploration of the ‘qualitatively different ways’ in which professional competence and associated CPD “are experienced, conceptualised, understood, perceived and apprehended” (Marton, 1994, p. 4424). ‘Bracketing’ is central to the phenomenographic approach and requires the researcher to effectively suspend research theories, previous research findings, researcher understandings, perceived notions, judgements, biases and own experience of a research topic (Merleau-Ponty, 1962). This ensures “phenomena are revisited, freshly, naively, in a wide-open sense” (Moustakas, 1994, p. 33) “in order to reveal engaged, lived experience” of research participants (Merleau-Ponty, 1962 cited in Ashworth, 1999, p. 708). In turn, participant experiences and understandings are examined and “characterised in terms of ‘categories of description’, logically related to each other, and forming hierarchies in relation to given criteria” (Marton, 1994, p. 4424). Such conceptions are assumed to have both meaning, a ‘what’ attribute, and structure, a ‘how’ attribute (Marton, 1994). The anticipated output from Researcher B’s study sought an understanding of professional competence (the ‘what’ attribute) and the manner in which individual practitioners achieve and maintain such competence (the ‘how’ attribute). Interviews were considered the most appropriate data collection method to gain this understanding. The professional status of practitioners was therefore central to Researcher B’s study and the research focused on gaining an understanding of individual perceptions and practices with regard to maintaining and further developing professional competence. Mindful of this focus, the following research questions were developed:
-
What does it mean to be a ‘professional’?
-
What does ‘professional competence’ mean?
-
How is professional competence maintained and developed?
4. The NVivo and Manual Approaches to Qualitative Data Analysis
While Researchers A and B addressed disparate research areas, the above discussion indicates that qualitative data analysis represented a significant and central component of both researchers’ doctoral studies. Both researchers adopted an interpretivist philosophy involving a broadly similar number of interviews (27 in the case of Researcher A and 23 in the case of Researcher B). Despite the similarities between Researchers A and B, their choice of approach to qualitative data analysis was fundamentally different, with Researcher A choosing the technological approach (i.e. NVivo) and Researcher B the manual approach. In the remainder of this section, we discuss the factors influencing the choices made by Researchers A and B and provide insights into the data analysis process conducted. We then present critical reflections and the challenges faced by both researchers, as they undertook their respective approaches to qualitative data analysis.
4.1 Researcher A: Factors Influencing Approach to Qualitative Data Analysis
A number of factors influenced Researcher A’s decision to use NVivo (version 12) over the manual approach of qualitative data analysis. The most prominent of these was the multidimensional nature of the data collected. Researcher A investigated the financial decision-making process of farmers by exploring both strategic and operational decision-making. The farmers interviewed operated different farm types, had diverse levels of formal education and their age profile varied. The presence of multiple attributes highlighted the importance of reporting findings not only on how individual farmers undertook decision-making, but also to engage in comparisons of decision-making in different types of farming, and to explore how demographic factors (e.g. education, age) affected farmers’ decision-making processes.
Researcher A explored the option of adopting a technological approach to data analysis at an early stage in his study by attending a training course on NVivo. Despite attending the training course with an open mind and being aware of the alternative manual approach of qualitative data analysis, the training course convinced Researcher A of the potential power of NVivo to assist in qualitative data analysis. In particular, Researcher A was drawn to the ‘slice and dice’ capability of NVivo, whereby data could be analysed for a specific type of decision (strategic or operational), across multiple farm types (dairy, tillage or beef), or with respect to the demographic profile of farmers (education, age). By setting up different types of decisions, farm types and demographic factors as overarching themes (referred to as ‘nodes’ in NVivo), NVivo presented Researcher A with the ability to conduct numerous queries to address the research objectives, whilst simultaneously facilitating the extraction of relevant quotations to support findings. While the analysis could have been conducted manually, the search facility within NVivo was considered by Researcher A to be a very useful function and more efficient than using word processing software, which would be used with a manual approach. An additional and related factor which influenced Researcher A’s decision to proceed with NVivo was the possibility of availing of on-going one-to-one support for the duration of the research project from an NVivo trainer, when the actual qualitative data analysis commenced. In addition, Researcher A’s decision to opt for NVivo was influenced by his supervisor’s experience when conducting her own PhD studies. To that end, Researcher A’s supervisor had experience of using a technological approach (NUD*IST) to undertake qualitative data analysis. As a result of her familiarity with a technological approach, and an overall relatively positive experience, Researcher A’s supervisor provided some reassurance that this approach, versus the manual approach, was appropriate.
Before finally making the decision to adopt either a manual or technological approach to qualitative data analysis, Researcher A engaged with the various academic debates in the literature concerning the appropriateness of both. Based on these debates, Researcher A was confident that the technological approach to qualitative data analysis was appropriate. However, reflecting the debates in the literature, Researcher A was particularly mindful that “[NVivo] is merely a tool designed to assist analysis” (O’Dwyer, 2004, p. 395) and that data analysis is ‘messy’ and very much the responsibility of the researcher who “must ask the questions, interpret the data, decide what to code” (Bringer et al., 2006, p. 248).
4.2 Researcher A: An NVivo Approach to Data Analysis
Researcher A conducted 27 in-depth semi-structured interviews with farmers to develop an understanding of their financial decision-making processes. As with any qualitative research project, prior to formal data analysis, there was a significant amount of work involved in ‘cleansing’ the interview data collected. Researcher A transcribed all interview recordings, after which transcriptions were listened to and carefully read to identify inaccuracies. Field notes were also written by Researcher A immediately after each interview and these complemented the analysis of qualitative data and assisted the researcher in being reflexive during the data analysis process.
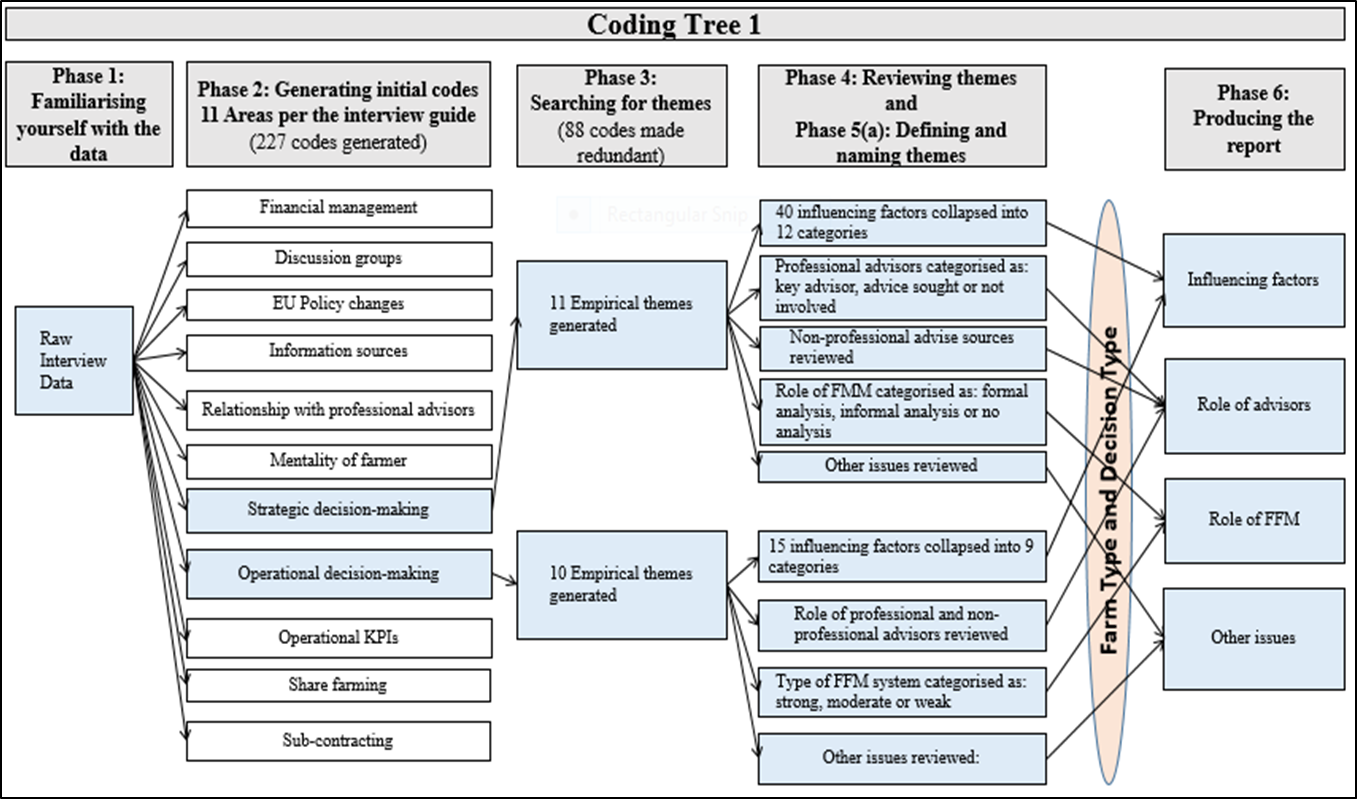
Researcher A adopted a thematic approach to qualitative data analysis as advocated by Braun & Clarke (2006). Thematic analysis is a method for identifying, analysing and reporting patterns (themes) within data, where a theme is “something important about the data in relation to the research question and represents some level of patterned response or meaning from the data set” (Braun & Clarke, 2006, p. 80). In undertaking qualitative analysis, Researcher A followed a six phase thematic data analysis process (see Figure 1) developed by Braun & Clarke (2006) as follows:
-
Familiarising yourself with your data – interview transcripts were read and re-read by Researcher A, noting down initial ideas. Interview transcripts were then imported into the data management software NVivo.
-
Generating initial codes – this phase, descriptive coding, involved the deconstruction of the data from its initial chronology. The inductive process resulted in 227 hierarchical codes identified from the interview data, across 11 areas.
-
Searching for themes – this phase involved reviewing the open coding, merging, re-naming, distilling and collapsing the initial codes into broader categories of codes. This allowed the data to be constructed in a manner that enabled the objectives of the research to be fulfilled. Phase 3 resulted in the generation of 11 empirical themes related to strategic decision-making and 10 related to operational decision-making.
-
Reviewing themes – a process of ‘drilling down’ was conducted, including re-coding the text in the initial codes, re-organising into a coding framework, and breaking the themes down into sub-codes to better understand the meanings embedded therein.
-
Defining and naming themes – this involved abstraction of the data into a broader thematic framework. Using an inductive process, data was coded in relation to the four components of research objective 1, namely influencing factors; role of advisors; role of FFM; and other issues.
-
Producing the report – the final phase involved writing analytical memos to accurately summarise the content of each theme and propose empirical findings. The analytical memos helped Researcher A to produce a timely written interpretation of the findings, with the addition of his own annotations and recollections from interviews. The analytical memos also greatly assisted Researcher A to draft the findings chapter of his PhD thesis.

4.3 Researcher A: A Critical Reflection and Challenges with NVivo Qualitative Data Analysis
Reflecting on the journey of using NVivo as an approach to qualitative data analysis, Researcher A observed a number of salient points. First, a considerable amount of time and commitment is involved in developing the necessary skills to use the technology. Initially some time and effort are needed to learn how to operate the technology and formal NVivo training provides an essential support mechanism in this regard, particularly where training utilises standardised test data. Formal training also provides the researcher with an excellent overview of the technology and its potential capabilities. However, Researcher A cautions that it is not until the researcher actually begins to analyse their own data, which could potentially be some months/years later given the nature of the PhD research process, that specific study-related queries in using NVivo emerge. Due to the potential time lag, the researcher may have forgotten many aspects covered during the training or they may encounter queries that they have not experienced before. Hence, further specific guidance and/or further training may be required from the service provider. On a positive note, Researcher A found that the significant time and commitment invested towards the beginning of the data analysis process reaped considerable benefits towards the latter end of the research project. In particular, the systematic and structured coding process conducted allowed the retrieval of multi-layered analyses of the data relatively quickly. Furthermore, NVivo enabled the researcher to analyse, compare and contrast various aspects of the data efficiently and effectively. This was particularly useful for Researcher A, given the multidimensional aspect of the data collected. The time invested in learning how to operate the technology is a transferable research skill that the researcher could use on future research projects. While Researcher A invested a considerable amount of time becoming proficient with NVivo, it should be noted that the cost of both the technological approach (licence fee for NVivo) and formal training was not an issue, as these were funded by the researcher’s institution.
Second, critical reflection by Researcher A highlights the need to be mindful of the inclination to quantify qualitative data when using data analysis technologies. To that end, the coding process undertaken when using NVivo has the potential to focus the researcher’s attention on counting and quantifying the number of times a particular issue is identified or emphasised in the data. Braun & Clarke (2006) highlight that there are no hard and fast rules on how to identify a theme during qualitative data analysis. One cannot quantify how many times an issue must appear in the data in order for it to be labelled a theme. Indeed, an issue may appear infrequently in a data set, yet be labelled as a theme. Therefore, researcher judgement is necessary in determining themes. During the initial stages of writing up the findings, Researcher A found the above to be a particular challenge, as NVivo focused his attention on counting the number of times a particular issue appeared in the data. The ‘counting’ of data can be done easily through NVivo via the generation of graphs, tables or charts at the ‘push of a button’. Such analyses are useful for presenting a high-level overview of issues emphasised in the data, but they can also distract from the richness of the underlying interview data. Reflecting on this, Researcher A identified that it was necessary to pause, refocus and consider the underlying essence of the interview data, alongside the more quantitative output that NVivo generates. This is an important issue that qualitative researchers need to be cognisant of, particularly those who are first time users of the technological approach to analysing qualitative data.
Third, Researcher A reflects that the coding and analysis of the large volume of qualitative data collected was challenging and there was a need to be tolerant of uncertainty during this process. In particular, there was an element of drudgery and repetitiveness in coding the data using NVivo, necessitating the need for resilience and a ‘stick with it’ attitude as it was necessary to consistently code all interview data. However, one of the main benefits of adopting a systematic process, such as that facilitated by NVivo, is that it provides a map and audit trail of how the coding and analysis process was conducted. To some extent, this helped to structure the “messiness” (O’Dwyer, 2004, p. 403) that is often attributed to qualitative data analysis.
Finally, reflecting on his overall experience, Researcher A found the NVivo data analysis software to be an excellent tool in terms of its ability to organise and manage qualitative data. In particular, the structured and systematic process of data analysis was very useful and effective. It is, however, important to note that while NVivo is a useful tool, it cannot replace the researcher’s own knowledge of the empirical data or the high level of research skills and judgement required to comprehend the data and elucidate themes, or the need for the researcher to be reflective in the data analysis process. In conclusion, Researcher A’s experience suggests that the benefits of using NVivo during the qualitative analysis phase outweigh the challenges it poses. Additionally, given the benefit of hindsight, Researcher A would use this technology in future qualitative research projects.
4.4 Researcher B: Factors Influencing Approach to Qualitative Data Analysis
A review of pertinent literature (Ashworth & Lucas, 2000; Larsson & Holmström, 2007; Svensson, 1997) highlights that there is no one ‘best’ method of phenomenographic data analysis. The overriding objective is to describe the data in the form of qualitative categories. This necessitates an approach for data analysis that enables resulting themes to be grounded in the data itself, rather than in prior literature or the researcher’s own experiences. However, Svensson (1997) cautions against replicating quantitative methodological traditions which view categories as “predefined assumptions” (p. 64). Mindful of this, and conscious that only a small number of phenomenographic studies had adopted a technological approach to data analysis at the time that Researcher B was making her decision on whether or not to adopt a technological approach (e.g. Ozkan, 2004), Researcher B selected a non-technological manual approach. A further factor impacting on Researcher B’s decision to proceed with the manual approach was a perception that technological approaches, such as NVivo, were not used extensively by qualitative researchers within the Higher Education Institution in which she was enrolled as a PhD student. Whilst completing her doctorate studies at a UK University on a part-time basis, Researcher B attended a number of research methodology training sessions (funded by the researcher’s institution) and research seminars. Researchers who presented their work had adopted a manual approach to qualitative data analysis and were not very knowledgeable in relation to technological approaches. This highlighted an absence of an established community of practice in this regard and could mean that any adoption of a technological approach might not be appropriately aligned with the research community.
The experience of Researcher B’s supervisory team also influenced her decision to adopt the manual approach of qualitative data analysis. To that end, Researcher B’s supervisory team had no experience of using a qualitative technological approach for data analysis. This problem was compounded in that the supervisory team also had limited experience of qualitative research and was therefore reluctant to recommend any specific approach to data analysis. Taking on board the above factors, Researcher B believed there was no compelling reason to adopt a technological approach, thus she was not positively disposed towards NVivo or other such technological tool for qualitative data analysis. As a result, Researcher B selected a manual approach to qualitative data analysis.
4.5 Researcher B: A Manual Approach to Data Analysis
Researcher B was conscious of the “inevitable tension between being faithful to the data and at the same time creating, from the point of view of the researcher, a tidy construction useful for some further exploratory or educational purpose” (Bowden & Walsh, 2000, p. 19). Reflecting this, the analysis phase sought to gain insights into interview participants’ perceptions, meanings, understandings, experiences and interpretations. Consistent with the phenomenographic approach, Researcher B was mindful of the need for conscious bracketing with reference to the analysis of the interviews.[2] This comprised careful transcription of interviews, with emphasis on tone and emotions, and simultaneous continuous cycles of listening to interview recordings and reading of interview transcripts to highlight themes.
Researcher B found “the path from interviews through inference to categories…quite a challenge” (Entwistle, 1997, p. 128). The substantial volume of interview data required multiple and simultaneous continuous cycles of reading, note-making, interpretation, write-up and reflective review and the overall analysis of hard copy transcripts was quite a “messy” process (O’Dwyer, 2004, p. 403). It comprised substantial participant quotes highlighted in an array of colours on transcripts, a large amount of handwritten suggested thematic descriptions on both left and right transcript margins and large quantities of post-it notes of varying shades attached to the transcripts.
In undertaking the manual qualitative data analysis, Researcher B methodically worked through a series of steps, based on the work of Lucas (1998) and Ashworth & Lucas (2000), as follows:
-
Familiarising self with the interviewee data and highlighting initial themes – Researcher B initially read each transcript a number of times and highlighted what she considered important elements of text with highlighter marker. She re-read each transcript a number of additional times and noted possible themes by writing on the right-hand margin of the hard copy transcript. She then highlighted more broad-based themes in the left-hand margin. Following this initial thematic identification, Researcher B re-read and listened to the interview recordings several more times, re-examining the analysis with a view to being methodical, yet open-minded about the content of the interviews.
-
Grounding themes in individual interviewee contexts – while many aspects of analysis focus on comparative experiences and mindful that these are of value, the phenomenographic approach positions individual experiences and lifeworlds as a backdrop to meanings. It was therefore important that individual experiences were not lost in an attempt to understand more generalising aspects. To this end, Researcher B also compiled individual interviewee profiles. The over-riding objective of this was to identify and examine particular points of emphasis that appeared to be central to the overall individual experiences with regard to development of professional competence. Such in-depth examination helped focus on the participants’ experiences and contributed to the empathetic understanding of participant perceptions, experiences, understandings and meanings (Lucas, 1998). This also helped to counter tendencies to “attribute meaning out of context” (Lucas, 1998, p. 138) and provided a means to understand participants’ experiences over a considerable period of time, from the point at which they made the conscious decision to gain admittance to the accounting profession up to the present day. This added considerable value to the analysis, not only helping to reveal what participants’ experiences and understandings of professional competence and professional development were, but also how participants shaped their ongoing actions and engagement with the development of professional competence. Predominant themes were then highlighted on the individual transcripts for each participant, in the participants’ own words. This served to maintain the bracketing process and ensured that themes were grounded in participants’ experiences.
-
Drafting initial thematic write-up – Researcher B drafted an initial descriptive thematic write-up, focussed around the research questions.
-
Reviewing interview data for supporting quotes – relevant interviewee quotes for each theme were subsequently included in the draft thematic write-up.
-
Reviewing thematic write-up – Researcher B re-read and listened back to the interviews several more times. She also searched individual interview transcript word documents for key words and phrases to highlight additional quotes to support thematic descriptions. She then spent some time editing the write-up with a view to generating a more “tidy construction” of descriptive overall categories (Bowden & Walsh, 2000, p. 19).
-
Generating categories of description – the final stage of analysis was the generation of overriding categories of description. The what aspect was used to characterise what professional competence means to participants (i.e. the meaning attribute) while the how aspect categorised how participant practitioners actually maintain and develop their professional competence (i.e. the structural attribute). Participants’ experiential stages were used to inform the hierarchy vis-a-vis these categories.
4.6 Researcher B: A Critical Reflection and Challenges with Manual Qualitative Data Analysis
Researcher B reflects on the challenges pertaining to data analysis during the course of her PhD study and highlights a number of issues. While the manual approach facilitated the generation and analysis of themes from the interview data, it was challenging to manage themes that were continuously being defined and redefined. Notwithstanding the iterative nature of the manual approach, Researcher B was confident that themes developed in an organic manner and were not finalised too early in the data analysis process. The ambiguity associated with the generation and analysis of themes also required Researcher B to bring high levels of research knowledge and skills to support this process and to be mindful of the need to embrace high levels of tolerance for uncertainty. Researcher B acknowledges that the iterative process of reading interviewee transcripts, listening to interview recordings (largely while in the car on the commute to and from work or while taking trips to see family at the other side of the country), generating themes, writing up themes, followed by re-reading messy transcripts and re-listening to the interview recordings while re-visiting themes, was both tedious and time consuming.
The initial excitement experienced when first listening to the interview recordings and reading the interview transcripts was somewhat depleted by the end of the process and work on the analyses increasingly developed into a test of endurance. Researcher B likened this to the declining enthusiasm often experienced by students from first reading a clean copy of a Shakespearian play in school, followed by subsequent grappling with syllabus requirements to dissect the play in multiple different ways in order to isolate significant events, explore characters, interpret language, examine subplots and understand larger themes. At the end of the school year, the once clean hard copy has become a heavily annotated and much more complex version of the original and the students’ enthusiasm considerably more subdued.
Researcher B also reflects that the manual approach required her to become very familiar with the interviewee transcripts and recordings, such that Researcher B could effectively match interview quotes to interviewees without having to check their provenance. Researcher B acknowledges that some participants provided more considered and more articulate responses to interview questions, and on review of the initial draft write-up, realised she had included excessive quotes centred around such participants. In subsequent iterations, Researcher B was careful to ensure the write-up was more representative of all of the interviewees and not dominated by a small number of interviewees.
As analysis progressed during the course of the doctorate, Researcher B presented draft write-ups of her findings to her PhD supervisors at various stages, largely to seek reassurance that data analysis was progressing appropriately. However, as indicated earlier, both supervisors had limited experience of qualitative data analysis and could provide little categorical reassurance regarding the manual approach to data analysis. As such, Researcher B had no systematic source of affirmation and was prompted to present at various doctoral colloquia to gain further insights and validation of the approach to analysis. This provided a useful, albeit more ad hoc, source of guidance and affirmation.
Finally, Researcher B reflects on the overall doctoral process and more particularly on the selection of a manual approach to data analysis. With hindsight, she recognises that while this approach enabled closeness to the interview data, data management involved a significant amount of time. For example, ‘cutting’ and ‘pasting’ within word documents which had to be done and re-done many times, reflecting the messiness of the data analysis. This was quite repetitive and was not an efficient means of organising data to support research findings. Researcher B believes that qualitative data analysis should enable both a closeness to the data and an efficient means of managing data. To that end, she would consider trialling measures to enhance the efficiency of data management in future research studies, including use of software tools such as NVivo.
5. Discussion and Conclusion
This paper addresses a gap in the literature by providing reflective and critical insights into the experiences of two PhD researchers undertaking qualitative studies which adopted different approaches to data analysis. The experiences and reflections of Researchers A and B highlight some similarities and differences worthy of note. In terms of background and motivations, while both researchers were investigating different research areas, qualitative data analysis was a central and shared aspect of both. To that end, both researchers were faced with the same decision regarding the choice of qualitative data analysis approach, Researcher A deciding on a technological approach (NVivo) and Researcher B opting for the manual approach.
Table 1 summarises the factors influencing the choice of data analysis approach adopted by Researchers A and B, together with the challenges and benefits of each. Interestingly, while the similarities in background and motivations detailed in the paper had little impact on both researchers’ decision regarding the qualitative data analysis approach, the factors influencing the choice were markedly different. To that end, Researcher B’s engagement with a more extensive literature exploring phenomenographic data analysis indicated that few prior studies had adopted a technological approach. Coupled with the lack of a community of practice with experience of using the technological approach, these factors were primary influences on Researcher B’s decision to adopt a manual approach. This decision has some parallels with O’Dwyer’s (2004) experience of discounting the technological approach at an early stage of his research based on his lack of understanding of what it could offer. In contrast, Researcher A’s decision-making process was largely influenced by the multi-dimensional nature of the interview data collected and exposure to an NVivo training course where the potential of the software’s ‘slice and dice’ and query capabilities were demonstrated. The possibility of accessing on-going NVivo one-to-one support for the duration of the research project was a further factor in Researcher A’s decision to use the technological approach. While different factors clearly influenced Researchers A and B’s decision regarding their qualitative data analysis approach, the experiences of their supervisory teams were common to both. Researcher A was influenced to ado,pt the technological approach as a result of his supervisor’s positive experience, while Researcher B was influenced to adopt the manual approach due to her supervisors’ limited knowledge or experience of the technological approach. This finding points to the importance of supervisors’ experience in informing the decision regarding the qualitative data analysis approach and highlights a potential danger of narrowing the data analysis choices available to the doctoral researcher.
The critical reflections of both researchers also elucidate some key challenges and benefits that qualitative researchers should be mindful of. Despite adopting different approaches, both researchers highlighted challenges in terms of the time consuming and labour intensive nature of their respective data analysis approaches, largely consistent with earlier findings (Bédard & Gendron, 2004). While Researcher A had to invest considerable time and commitment in developing the skills required to use NVivo, this reaped significant benefits towards the latter end of his research project in terms of the efficient retrieval of information, confirming previous literature (Basit, 2003; García-Horta & Guerra-Ramos, 2009; Zamawe, 2015). Researcher B also noted a challenge around the time-consuming nature of the data analysis process using the manual approach and the significant investment in time for activities such as listening to recordings, reading and re-reading of transcripts, and ‘cutting’ and ‘pasting’ which had to be done and re-done, again consistent with earlier research findings (Basit, 2003; Bogdan & Bilken, 1982; Lofland, 1971; Maher et al., 2018; L. Richards & Richards, 1994). Researcher A’s experience, however, highlights a further challenge not identified in the prior literature with respect to investment in time, namely the resulting time lag that can occur between the timing of initial NVivo training and the actual use of the technology, with the result that important knowledge and skills relevant to analysis have been ‘forgotten’.
Both researchers also highlighted an element of drudgery and repetitiveness in coding their data and developing themes, and the need for resilience (Researcher A) and endurance (Researcher B) in this regard. Drawing on their experiences, both researchers were mindful of “being tolerant of uncertainty [which] is part of the fundamental skills of the qualitative researcher” (Bédard & Gendron, 2004, p. 199). Irrespective of the approach to qualitative data analysis, both Researchers A and B were also cognisant of the importance of retaining a level of ‘closeness’ to their data and an awareness that the approach to analysis cannot substitute for the researcher’s own knowledge of the empirical data (O’Dwyer, 2004). Furthermore, Researchers A and B’s experiences provide new insights to the literature. Researcher A recognised the potential danger of NVivo over-focusing the researcher’s attention on counting and quantifying and how this might negatively impact in terms of maintaining a level of closeness with the data. In addition, Researcher B cautioned against the possibility of being ‘too close’ to some interviewee data when using a manual approach, and the need to continually and consciously ensure that the qualitative data analysis was representative of all interviewees. Reflecting further on the tedious nature of the manual process, Researcher B reported an additional challenge in that a significant amount of time had to be devoted to data management activities (i.e. cutting and pasting into word documents) given the ‘messiness’ of her data analysis.
Both researchers identified some benefits of their respective data analysis approaches. Researcher A recognised that the technological approach, NVivo, provides a systematic coding process with a clear audit trail which helps to structure the ‘messiness’ attributed to qualitative data analysis (O’Dwyer, 2004, p. 403). In addition, Researcher A highlighted that NVivo is an excellent tool in terms of its ability to organise and manage qualitative data. The skills developed as a result yield significant benefits in terms of facilitating multi-layered analyses that can be used in future research projects. In contrast, Researcher B reflected on how the manual approach facilitated a closeness to the qualitative data (notwithstanding the challenge highlighted earlier in this regard) and that this approach facilitated the identification of themes in an organic manner.
The preceding discussion lends support to the conclusion that the choice of a manual or technological approach to qualitative data analysis is influenced by multiple factors. In making a decision regarding the approach to data analysis, researchers need to be cognisant of the potential challenges and benefits of their choices. Ultimately, however, the final decision regarding the approach to adopt is a personal choice. Irrespective of the choices available to the researcher, it is important to acknowledge that qualitative data analysis is “the most intellectually challenging phase” of qualitative research (Marshall & Rossman, 1995, p. 114). Described as ‘messy’ by O’Dwyer (2004), qualitative data analysis is also labour intensive, requiring high levels of research knowledge and skills, and associated with the need to be tolerant of uncertainty (Bédard & Gendron, 2004). The experiences and reflections of both researchers in this paper provide evidence of these challenges. While this paper provides insights into the choice of qualitative data analysis approach, a limitation is that it does not address how manual or technological approaches to qualitative data analysis consider issues related to the quality of data analysis undertaken. For example, Pratt et al. (2019) highlight the need to identify solutions for enhanced trustworthiness (an aspect of quality) in qualitative research. Further research might consider how the manual and technological approaches address such issues. Another limitation of the paper is that the experiences outlined reflect those of two individual researchers. These experiences may not be reflective of the experiences of others who engage in the manual or technological approaches to qualitative data analysis. Further research which more broadly compares the experiences of other qualitative researchers would add greater insights in this under-researched area.
The paper contributes to the limited literature on the comparative experiences of those undertaking qualitative data analysis using the manual and technological approaches. In so doing, we identify the factors influencing the choice of approach, confirming in some respects prior findings in the literature, but also adding to the small body of prior literature. We further contribute to the limited literature by adding insights into the challenges and benefits of the manual and technological approaches to qualitative data analysis. “Given the popularity of interviews as a method of qualitative data collection in accounting” (Lee & Humphrey, 2006, p. 188), the paper adds insights into how researchers address one of the key problems they face, namely how to analyse interview transcripts using the manual and technological approach. We thereby respond to calls from Edwards & Skinner (2009) and Paulus et al. (2017) for future studies to provide insights into qualitative researchers’ experiences of using the manual and technological approaches to data analysis. We hope that the experiences and reflections articulated in this paper, including the factors impacting on and the challenges and benefits of using the manual and technological approaches, will guide qualitative researchers in making important decisions regarding their approach to data analysis. The issue of how to analyse qualitative data, and whether to use manual or technological approaches is often a source of difficulty for researchers, we hope that this paper will initiate further debate around this important decision.
The manual approach involves analysing qualitative data without the use of computerised data analysis software.
The issue of bracketing is a core element of the phenomenographic research approach, irrespective of the selection of a manual or a technological approach to data analysis.