1. Introduction
Social security, defined contribution plans, and defined benefit pension plans (DBPPs) comprise the main sources of retirement income in the United States (US) (US Securities and Exchange Commission, 2005). While defined contribution plans increased from approximately 200,000 plans in 1975 to more than 640,000 plans in 2014, DBPPs steadily declined from over 100,000 plans to less than 45,000 plans during the same timeframe (US Department of Labor, 2016). DBPPs, if in place, represent a legal obligation of employers, for which the financial magnitude may be large. Hence, DBPPs represent a potentially significant source of financial risk for corporate pension plan sponsors.
While not legally obligated to offer pension plans or other retirement benefits to employees, firms use such benefits to attract and retain employees. Most publicly traded corporations offer some type of retirement savings vehicle, most commonly in the form of a defined contribution plan (e.g., a 401(k) plan), which is primarily funded by the employee. Those offering DBPPs are obligated to make good on the promise to pay a pension in keeping with the regulatory requirements of the Employee Retirement Income Security Act of 1974 (ERISA).
Furthermore, DBPP sponsors are subject to federal regulation by the Internal Revenue Service, the Department of Labor, and the Pension Benefit Guaranty Corporation (PBGC). The PBGC insures private pension plans and acts as a safety net in the event of a firm defaulting on its obligation to pay defined benefits. Additionally, the Securities and Exchange Commission (SEC) mandates that publicly traded firms report their financial performance in accordance with Generally Accepted Accounting Principles (GAAP), for which the main standard setter is the Financial Accounting Standards Board (FASB).
This study extends prior research on the financial reporting effects of the FASB’s Statement of Financial Accounting Standards No. 158: Employers’ Accounting for Defined Benefit Pension and Other Postretirement Plans (SFAS 158, now part of FASB’s Accounting Standards Codification Topic 960) by reviewing the literature, then investigating private DBPPs from 1999 to 2015, before and after the 2006 adoption of SFAS 158. Prior research suggests that, after the adoption of SFAS 158, the discount rate used by firms to determine the amount of projected benefit obligation (PBO) increased and that those increased PBO discount rates were positively correlated with firms’ leverage (Houmes & Boylan, 2010). It is also worth noting that under International Financial Reporting Standards (IFRS), IFRS IAS 19 Employee Benefits (specifically, paragraph 83, Actuarial assumptions: discount rate) is analogous to SFAS 158.
Since a negative relationship exists between PBO discount rates and pension liability (the higher the discount rate, the lower the pension liability), Houmes and Boylan (2010) theorize that the observed positive correlation between PBO discount rates and leverage is due to the relationship between PBO discount rates and pension liability. Hence, there is a tendency for highly leveraged firms to use higher discount rates to reduce reported PBO (Houmes & Boylan, 2010). The current study examines whether SFAS 158 (adopted the same year the US Congress enacted the Pension Protection Act of 2006 (PPA)) may have had unintended consequences of managers employing higher PBO discount rates and, hence, reporting lower pension liability, thereby exacerbating pension underfunding with implications for investors, pension plan sponsors, pension plan participants, and indeed, the overall economy.
Pension Accounting History
Pre-SFAS 158
A lack of transparency and understandability among users, complex computations, and failure to require relevant disclosures constitute some of the criticisms of pension accounting (US Securities and Exchange Commission, 2005). Arguably, determining pension obligations is a complex issue that, among other things, involves estimating employees’ life expectancies, projecting investment performance, assuming expected salary increases, and discounting future pension benefits to present value—all of which are difficult to measure. One of the overarching criticisms of pension accounting is that the required accounting disclosures for DBPPs may be unnecessarily complicated. Furthermore, as it pertains to presumed financial statement users, the average DBPP participant is not financially sophisticated (Easterday & Eaton, 2012). Pension accounting guidance makes it difficult for financial statement users to understand how pension liability affects a company’s financial position or its ability to meet pension plan obligations (Response to FASB Exposure Draft, 2007).
Undeniably, prior to the adoption of SFAS 158, a potentially material amount of pension liability could be off balance sheet (FASB, 1985). Furthermore, pension gains and losses could be recorded at any time before the pension obligations were due (FASB, 1985). Since immediate recognition of pension gains and losses would likely result in volatile pension expenses, many plan sponsors chose to defer recognition of pension gains and losses, resulting in smoother pension expensing between accounting periods (US Securities and Exchange Commission, 2005). However, this decision caused greater uncertainty regarding the reported net retirement plan asset or liability (US Securities and Exchange Commission, 2005).
The FASB attempted to mitigate the effects of smoothing pension expenses and, thereby, reduce the amount of retirement liability that could potentially be off balance sheet by issuing Statement of Financial Accounting Standard No. 87: Employers’ Accounting for Pensions (SFAS 87) in 1985 (US Securities and Exchange Commission, 2005). SFAS 87 required firms to accrue an actuarially derived pension expense each year, better aligning pension accounting with accrual-basis accounting required by GAAP (FASB, 1985). SFAS 87 also instituted a “minimum liability rule”, under which plan sponsors electing to defer pension gains and losses were required to recognize a liability of at least the amount by which the accumulated benefit obligation (the best estimate of the present value of future pension payments, excluding future salary increases) exceeds the fair value of pension plan assets (FASB, 1985).
However, even when recognizing the minimum liability, a significant amount of a sponsor’s pension obligation could remain off balance sheet, since the minimum liability was based on accumulated benefit obligation instead of PBO, which considers the effects of expected salary increases (US Securities and Exchange Commission, 2005). The funded status, calculated with PBO, was merely disclosed in the notes to financial statements. Although additional pension-related standards (SFAS Nos. 88, 106, and 132 R) followed the issuance of SFAS 87, it remained the predominant guiding accounting standard for DBPPs for more than 20 years.
SFAS 158’s Impact on Pension Accounting
The FASB issued SFAS 158 in 2006, creating a more stringent DBPP regulatory environment, with more prominent reporting of pension liability. Among other things, SFAS 158 mandates that firms with DBPPs recognize the funded status of their pension plan on the balance sheet (FASB, 2006). Funded status is measured as the difference between the plan’s PBO and the fair market value of its assets (FASB, 2006). The PBO is defined as the value of future pension benefits discounted to actuarial present value (FASB, 2006).
Previously, pension liability had been disclosed in the notes to the financial statements. The adoption of SFAS 158 was intended to be an improvement to pension accounting. However, based on their findings, Adams et al. (2011) urge regulators to focus on more appropriate ways to help financial statement users assess the risk of companies’ pension portfolios. They note that certain disclosures — the DBPP audit opinion, risk assessment of plan termination, and reportable events (required by the PBGC) — could potentially help plan participants but are not required by SFAS 158. Thus, although the adoption of SFAS 158 may have improved pension accounting, criticism of pension accounting endures.
After examining public and private sector pension plans (post SFAS 158), Easterday and Eaton (2012) assert that all users of financial statements—from financial experts to average pension-plan participants—should be able to clearly understand any issues related to the funding, stability, and financial management of DBPPs by reviewing the financial statements and their accompanying notes. However, the literature reveals that this is not the case. Kiosse and Peasnell (2009) document that current pension accounting requirements do not convey useful information regarding the long-term costs of providing a DBPP. Investors need supplementary information to assist with understanding the uncertainties of pension commitments that stretch far into the future (Kiosse & Peasnell, 2009). Consistent with Kiosse and Peasnell (2009), current required disclosures do not provide enough information to adequately assess risk, since they “do not hit the core issues relating to pensions” (Rangecroft, 2009). The perceived flaws in DBPP financial reporting indicate that there are significant opportunities to improve accounting standards related to pension plan reporting.
Although criticism persists, the adoption of SFAS 158, in some ways, simplifies disclosure requirements by eliminating the need to reconcile a pension plan’s funded status with the amount recognized in the firm’s balance sheet, since the funded status is now recognized directly on the balance sheet (instead of disclosed in the notes). In addition, SFAS 158 eliminates the disclosure of the plan’s measurement date by requiring the firm’s fiscal year end to coincide with the DBPP’s measurement date.
Recognition Versus Disclosure
The adoption of SFAS 158 represents a change in accounting standards that required a transition from disclosure in the notes to the recognition of the funded status of firms’ pension obligations on their balance sheets aligning with the FASB declaration that “footnote disclosure is not an adequate substitute for recognition (FASB, 1985)”. Regarding the financial reporting of pension assets and liabilities, Coronado et al. (2008) find that investors focus on the face value of financial statements instead of the more detailed information reflected in the notes accompanying the financial statements. The Coronado et al. (2008) study supports the findings of earlier, non-pension related, research which indicates that capital markets value disclosure and recognition differently (e.g., Aboody, 1996; Davis-Friday et al., 1999, 2004). Combined, these studies provide support for SFAS 158’s change from note disclosure to recognizing the funded status of plan assets on the balance sheet.
Specifically, prior research suggests that the decision to recognize rather than disclose a write-down impacts firms’ market valuation (Aboody, 1996). Likewise, results of the Davis-Friday et al. (1999) study indicate the market attaches less weight to post-retirement benefit (PRB) liabilities disclosed in the notes than to those subsequently recognized in the balance sheet. In a related study, Davis-Friday et al. (2004) investigate whether the market treats disclosed financial statement information as if it is less reliable than information recognized in the body of the financial statements. Overall, the findings indicate that the market treats disclosed PRB liabilities as less reliable than recognized PRB liabilities and pension liabilities (Davis-Friday et al., 2004).
Other literature indicates that financial statement users incorporate information disclosed in the notes to the financial statements (Response to FASB Exposure Draft, 2007). Nevertheless, those results are based primarily on stock analysts’ predictions and credit agency ratings, indicating more sophisticated financial statement users. Although the literature contains conflicting results, the Davis-Friday et al. studies (1999, 2004) imply that SFAS 158’s requirement to recognize pension liabilities on the balance sheet (instead of mere disclosure in the notes) represents an improvement in the financial reporting of pension accounting information.
Finally, Beaudoin et al. (2010) explore whether SFAS 158’s required recognition of pension assets and liabilities is value-relevant when compared to those same items previously only disclosed in the notes to the financial statements. (In this context ‘value-relevant’ relates to whether the presentation format – note disclosure versus direct placement on the balance sheet – makes a difference to how the market values a firm’s stock price.) Their findings support efficient markets theory: regardless of whether pension obligations are disclosed in the notes (as required pre-SFAS 158) or recognized directly on the balance sheet (as required post-FAS 158), the results suggest that there are no significant differences in how the market uses pension-related information to determine equity valuation (Beaudoin et al., 2010). The implication is that as long as the information is available, it will be reflected in stock price.
Accounting Standard Changes and Management Decisions
Empirical evidence implies that new accounting standards impact management decisions. For example, Mittelstaedt et al. (1995) observe that companies limited the offering of post-retirement healthcare benefits after the adoption of Statement of Financial Accounting Standard No. 106: Employers’ Accounting for Postretirement Benefits Other Than Pensions (SFAS 106) which requires the accrual of post-retirement healthcare benefits (FASB, 1990). Jones (2013) documents that recognition, rather than disclosure, of retirement liabilities may affect management’s accounting choices. Likewise, non-pension-related prior research documents that managers perceive recognized amounts differently than disclosed amounts and that this perception affects their actions (Aboody et al., 2004; Bens & Monahan, 2008; Carter et al., 2007; Imhoff & Thomas, 1988; Johnston, 2006).
Accounting standard changes appear to have real effects on management decisions (Bens & Monahan, 2008). Findings of a study by Carter et al. (2007) suggest favorable accounting treatment for stock options led to increased use of options and decreased use of restricted stock than would have been the case without the change in the relevant accounting standards. Johnston (2006) reports that firms that recognize stock-based compensation expense-manage it downward more so than firms that disclose the expense in the notes to the financial statements. Similarly, Aboody et al. (2004) find that the likelihood of expense recognition under Statement of Financial Accounting Standard No. 123: Accounting for Stock-Based Compensation (SFAS 123) is linked to the personal remuneration incentives of top management.
Finally, Imhoff and Thomas (1988) report a substitution from capital leases to operating leases and non-lease sources of financing after the adoption of Statement of Financial Accounting Standard No. 13: Accounting for Leases (SFAS 13). Although not all pension related, the literature on the impact of new accounting standards on management decisions suggests that changes in accounting standards affect management decisions and, specifically, that managers perceive recognized amounts differently than disclosed amounts, which also alters their decisions.
Incentives to Manage the Projected Benefit Obligation Discount Rate
The FASB’s sole guidance regarding an appropriate pension benefit discount rate stipulates that it be based on the rate at which the retirement benefit could be effectively settled and should reflect the “rates of return on high-quality fixed-income investments” (FASB, 2006). Consequently, management has discretion in setting the PBO discount rate. Since actuaries estimate future pension benefits over typically extensive time horizons, small changes in the discount rate could significantly affect the magnitude of a DBPP’s PBO.
Certainly, prior studies have reported that after the adoption of SFAS 158, firms use higher discount rates to calculate pension liability, and the higher a firm’s financial leverage (liquidity), the greater (lower) the PBO discount rate (Houmes & Boylan, 2010). Additionally, Asthana (1999) notes that the likelihood of managers making PBO-decreasing choices increases with the magnitude of pension underfunding. Furthermore, Houmes et al. (2011) find that firms use higher discount rates to estimate pension liabilities to offset the impact of reporting PBO. They also report that firms with high financial risk earned negative abnormal returns (and vice versa) on or near relevant event dates immediately preceding the adoption of SFAS 158. Rauh’s (2006) findings suggest a negative relationship between underfunded DBPPs and future cash flows, thereby limiting the ability to invest in capital projects as firms comply with pension funding requirements (Rauh, 2006).
Likewise, prior research documents the tendency of highly leveraged firms to reduce retiree healthcare benefits after the implementation of SFAS 106 (Mittelstaedt et al., 1995). D’Souza et al. (2001) observe that companies with higher liabilities were more likely to select the prospective adoption of SFAS 106, which allowed postponed recognition of PRB liability.
Jones (2013) finds that after the phase-in of SFAS 158, companies with debt-contracting incentives made larger PBO-decreasing changes to assumptions used to estimate retirement plan obligations—one of the most commonly disclosed assumptions being PBO discount rate. Furthermore, the inherent complexities and specialized knowledge intrinsic to DBPPs generally require external auditors to engage specialists (i.e. actuaries) when conducting DBPP audits. Similar to the International Auditing and Assurance Standards Board’s (IAASB) International Standard on Auditing (ISA) 620 Using the Work of an Auditor’s Expert, the Public Company Accounting Oversight Board (PCAOB) and the American Institute of Certified Public Accountants (AICPA) have set forth auditing standards related to engaging the work of a specialist. Although the PCAOB standards in place during the study period required the auditor to acquire an understanding of the methods and assumptions of a specialist when using the specialist’s findings for an external audit, the specialist retained the responsibility for determining the appropriateness and reasonableness of the assumptions used (PCAOB, 2016). In other words, auditors relied upon the expertise of actuaries to assess the fairness of the PBO discount rate employed by a plan sponsor. Thus, it appears the ambiguity and audit complexity surrounding PBO discount rates may have incentivized managers of firms with high financial risk to manage the PBO discount rate.
The tendency to manage financial reporting is consistent with agency theory, which posits that an inherent conflict of interest exists between a firm’s principal (shareholders) and the agent(s) hired to act on the principal’s behalf (management). Jensen and Meckling (1976) propose that tying management compensation to firm performance attenuates this conflict of interest. Conversely, the opportunistic perspective of positive accounting theory argues that managers with compensation tied to firms’ financial performance tend to manipulate the accounting methods employed to report financial performance that appears better than it is (Watts & Zimmerman, 1978). According to the report titled “CEO and executive compensation practices: 2015 edition”, performance-based components primarily comprise CEO compensation (Tonello, 2015).
This current study considers the opportunistic perspective of positive accounting theory where managers adopt accounting policies that result in both the firm’s and their own personal gain. Specifically, within the framework of the opportunistic perspective, this paper leans toward the debt–equity hypothesis, which contends that there is a positive relation between the likelihood of managers exploiting accounting methods to increase accounting profit and the magnitude of debt reported on a firm’s balance sheet. In other words, as debt increases, so does the tendency of managers to use accounting practices that appear to improve financial position. Thus, the ambiguity in SFAS 158 regarding the PBO discount rate is likely to have heightened the incentive for managers of firms with high financial risk to employ a PBO discount rate that reduces pension liability resulting in reported financial performance that appears better than it is.
2. Methods
Hypotheses
Pension default risk measures the likelihood that a firm providing a DBPP to its employees will not be able to meet its pension obligations. Since a mechanical inverse relationship exists between the rate used to discount future pension benefits and the magnitude of the PBO, we contend that incentives to report lower PBO, thereby minimizing reported pension underfunding which, in turn, results in reporting more favorable financial performance (all of which are associated with high pension default risk), motivate managers to use higher discount rates, and this relationship increases as the financial risk of the firm increases. Although prior studies support this assertion (Asthana, 1999; Houmes et al., 2011), they do not evaluate the effect of pension default risk on the PBO discount rate. We test this conjecture with the following hypotheses:
H1: Ceteris paribus, a firm’s PBO discount rate increases as pension default risk increases.
H2: The positive relation between the PBO discount rate and a firm’s pension default risk is more pronounced for highly leveraged firms.
Intuitively, firms with relatively low PBO discount rates have more latitude to increase those discount rates. Thus, we also contend that managers of firms with high pension default risk that employ relatively low PBO discount rates have a greater susceptibility to employ higher PBO discount rates as pension default risk increases. We test this speculation with the following hypothesis:
H3: The positive relation between the PBO discount rate and pension default risk is greater for firms with relatively low PBO discount rates.
Data and Methodology
Data used here are longitudinal and come from the Compustat database of publicly traded North American companies. The panel spans fiscal years 1999 through 2015 and is constrained to firms with DBPPs. Specifically, the sample is comprised of 3,702 firms with an overall sample size of 30,634 firm years. In the interest of data disclosure, Table 1 presents summary statistics for the variables used. Key variables include pension default risk (PDR), PBO discount rate, an indicator for the period when PPA/SFAS 158 was in effect, and an indicator for highly leveraged firms. Here, we define a highly leveraged firm as one with a long-term debt-to-total assets ratio greater than one (though similar definitions yield similar results in robustness checks). As shown in the bottom panel of Table 1, 16 different firm-year-specific control variables are used in the regression analyses. Some control variables are logged by convention. The individual variable sample sizes displayed in the last column demonstrate that there are some missing values among the control variables. A discussion and depiction of each model, in equation form, is included in Appendix A.
3. Results
Table 2 presents the results from models of equation (1), which estimate the effect of PPA/SFAS 158 on the PBO discount rate. Key results are shown for four different variations of this model. Consistent with prior research, we confirm that this effect is positive and statistically significant, that PPA/SFAS 158 resulted in firms increasing PBO discount rate, on average. Additionally, we find support for the idea that this impact was larger in magnitude for highly leveraged firms. However, once unobserved heterogeneity across firms is held constant through fixed effects (column 3), the difference between highly leveraged and other firms is no longer statistically significant. Once multiple imputation is used to address missing values among the firm-year specific control variables, the statistical significance does return, though only at the 90% confidence level. This implies the possibility that the reason highly leveraged firms are differentially affected is significantly related to firm-level characteristics, like management culture, that are typically unobservable in financial data such as this dataset of publicly traded North American companies.
Quantile regression results from equations (2) and (3) (see Appendix A) are shown in Table 3. These estimates disclose three new characteristics about the impact of PPA/SFAS 158 on the PBO discount rate. First, regarding statistical significance, the impact appears to persist for firms across the PBO distribution, i.e., both high-PBO and low-PBO firms were affected, along with median-PBO and other firms. Second, the effect monotonically increases as one moves up the PBO distribution, from an estimated impact of 0.229 near the 5th percentile of PBO to 0.500 near the 95th percentile of PBO. In other words, the effect of PPA/SFAS 158 on the PBO discount rate is larger for high-PBO firms than for low-PBO firms. Third, the difference in this effect between highly leveraged firms and others is not statistically significant at the low end of the distribution and shrinks in magnitude among high-PBO firms, where the general effect is already larger.
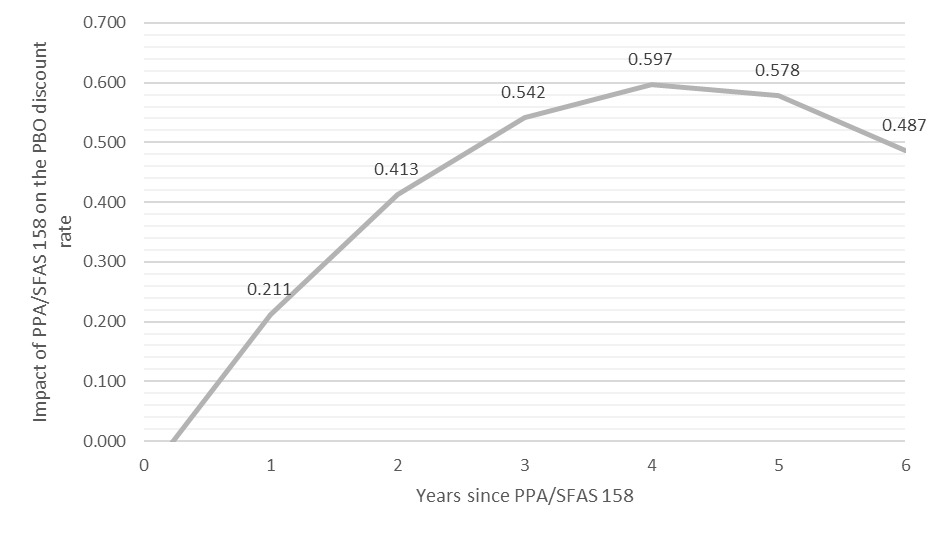
The functional form of the regressions behind the results presented in Tables 2 and 3 assumes that the impact of PPA/SFAS 158 on the PBO discount rate is flat (the same in each year following implementation). However, this is unlikely for the average firm. To examine the timing of this estimated effect, an additional regression was performed that includes more independent variables but is otherwise similar to the model presented in column 4 of Table 2. The two new key variables are interaction terms between the PPA/SFAS 158 variable and a time trend as well as its square. The latter allows for a quadratic trend as opposed to a simple linear trend, and higher order terms (e.g., cubic) were found to be statistically insignificant. The coefficients from this regression were then used algebraically to estimate the relationship between PPA/SFAS 158 and the PBO discount rate in each year (since available data are annual) post-implementation. Results are presented as Figure 1. As shown in Figure 1, for the average firm, the impact took less than a year to materialize, peaked approximately four years later, and then began to decline.

H1 states that a firm’s PBO discount rate increases as its pension default risk increases, while H2 states that this relationship is more pronounced for highly leveraged firms. These hypotheses are tested by the models presented in Table 4. Note that low values of the PDR variable correspond to high risk. Thus, if H1 were true, one would expect to see negative estimates of This is indeed the case. We find evidence that PDR causes the PBO discount rate to increase in all models where firm observables and/or unobservables are held constant. However, we find no evidence that H2 is correct. The impact of PDR on PBO discount rate does not appear to be different, in a statistically significant way, across highly leveraged and other firms. In short, regarding H1, the findings suggest that as pension default risk increases, firms employ higher PBO discount rates. However, there was no uncovered evidence to support H2.
H3 states that the relationship between pension default risk and PBO discount rate is larger for firms employing relatively low PBO discount rates. This hypothesis is tested by the model presented in Table 5. We find that the effect of pension default risk on the PBO discount rate is indeed constrained to median- and low-PBO firms. In other words, the impact of PDR on PBO discount rate is statistically insignificant for above-median PBO firms. Beyond that, the magnitude of the estimated effect is over 10 times as large for firms near the 5th percentile of PBO compared to median-PBO firms.
4. Discussion
Implications and Practical Application
The 2006 adoption of SFAS 158 and the PPA legislation created a more stringent DBPP regulatory environment, with more prominent reporting of pension liability. Prior research documents that the discount rate used to determine PBO increased in the years following these legislative and accounting standard changes and that the increased discount rate is positively correlated with highly leveraged firms (Houmes & Boylan, 2010). Building on prior research by using more robust analysis methods, this study confirms the previous findings. Moreover, our findings suggest that as pension default risk increases, firms employ higher PBO discount rates (H1). Additionally, the findings support our conjecture that the relationship between pension default risk and PBO discount rate is larger for firms employing relatively low PBO discount rates (H3).
Although the results do not support our hypothesis that the relation between the PBO discount rate and firms’ pension default risk is more pronounced for highly leveraged firms (H2), the overall finding that PBO discount rates increase as pension default risk increases promoted initial conjecture that the intended improvements to pension accounting standards may have had an unintentional consequence of further understating pension liability, possibly exacerbating pension underfunding. Indeed, there were many years of pension underfunding post 2006. On the contrary, however, the funded status ratio of US corporate defined benefit pension plans (as measured by the Milliman 100 Pension Funding Index) now exceeds 100% (Wadia, 2025). Since firms’ ability (or lack thereof) to meet their pension obligations affects investors, plan sponsors, plan participants, and the US economy overall, this study’s findings provide useful insights to regulators when devising accounting standards and federal statutes affecting DBPP.
Specifically, FASB guidance, which is principles-based, stipulates that PBO discount rates used to calculate pension liability should reflect the “rates of return on high-quality fixed-income investments” as of the measurement date (FASB, 2006) allowing managers leeway to maneuver the financial reporting of pension liability. Opportunely, the US Congress addressed this dilemma with the Moving Ahead for Progress in the 21st Century Act which allows for “pension smoothing” by requiring the alignment of PBO discount rates with the 25-year average of corporate bond yields (Townsend, 2023). With the passage of subsequent legislation, this rule has been extended through 2035 (Townsend, 2023)—probably mitigating managers’ incentives to report lower PBO, minimize pension underfunding, and report financial performance that appears more favorable than it is. Also, explicit guidelines for the PBO discount rate probably reduces managers’ opportunities to use the leeway in existing accounting standards to manipulate the financial reporting of pension liability.
Furthermore, financial reporting for DBPPs might be improved by creating accounting standards and developing legislation designed to work in tandem. Within the current DBPP regulatory environment, SFAS 158 is concerned with accruing pension expense and reporting the corresponding liability on the face of the balance sheet. The PPA’s focus is to mandate and incentivize firms to fund their pension plans beyond 100%, which, if acted upon, affects cash flow. Developing accounting standards and legislation that reinforce one another may assist in achieving improved transparency in DBPP financial reporting and decreased pension underfunding.
5. Conclusion
This study explores the influence of SFAS 158 and the PPA of 2006 on the financial reporting of DBPPs. Using more rigorous analysis methods, we confirm two previous findings: after PPA/SFAS 158, firms increased their PBO discount rates and this effect is larger for highly leveraged firms (Houmes & Boylan, 2010). Further, our findings only marginally suggest that the effect of PPA/SFAS 158 on PBO discount rates is larger for highly leveraged firms (those at the high end of PBO distribution). In sum, we find evidence supporting the idea that pension default risk increases PBO discount rates, with the impact not statistically different for highly leveraged firms. Finally, this effect is larger for firms with relatively low PBO discount rates.
Nevertheless, the current study has limitations, the most apparent being that it relates to SFAS 158 and PPA, both implemented in the same year (2006), making it difficult to determine whether the observed relationships are more attributable to the changes in accounting standards or the legislative changes. Yet, this limitation provides an opportunity for future research that disentangles the SFAS 158 and PPA phenomenon and would likely allow for more decisive implications, potential application, and contribution to the literature regarding private US DBPPs and the impact of new legislation/regulation on pension accounting and reporting.
Moreover, similar studies of public sector pension plans could also provide worthwhile insights, particularly since state and municipal pension funds have been widely reported as being underfunded. In any event, the current study, apart from its limitations entailing future research possibilities, offers insight into the enormous complexity of the DBPP regulatory environment.